Ballot Product Tour
Ideas
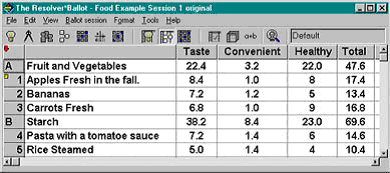
The ideas you enter may apply to many situations. Your ideas may
be objectives, strategies, tasks, issues, products or what ever
you require.
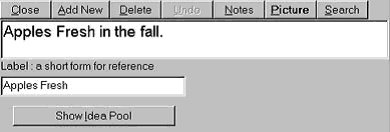
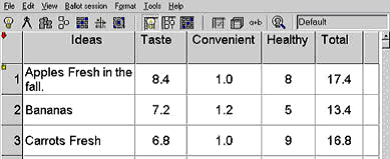
Your Ideas will
be rated or ranked based on the criteria you define.
Criteria
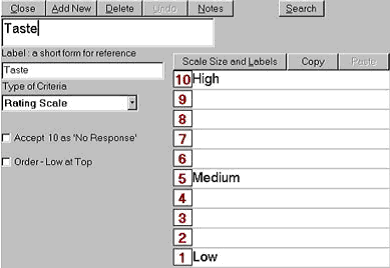
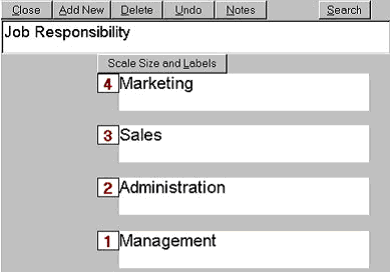
The criteria you enter will define how your ideas will be rated
or ranked through voting. Criteria may be defined to establish a
scale of one up to ten for rating or to define context and comparative
statements by which the ideas are ranked.
Stake
Holders
The stakeholders
are those participating in the voting. Groups may be defined and
voters may then record themselves as members of one or more groups.
The results of voting may be viewed for an individual stakeholder
throughout The Resolver* Ballot.
Groups
Ideas may now
be "Grouped" to provide better focus upon select or related
items as needed
Voting
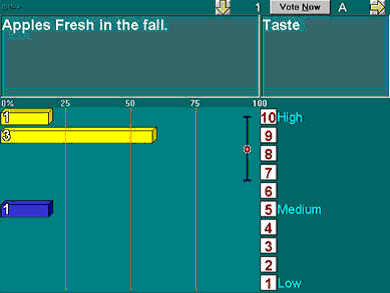
The voting on
ideas allows autonomous input and immediate analysis and presentation.
Voting is carried out using wireless keypads and a receiver which
connects to the serial port of your computer. Participants view
each idea for a criterion and vote based upon the scale displayed
(which you defined!). Information may be gathered from up to 2000
voters using (up to) 8 receivers of 8 different channels. Voting
for a criterion which defines a rating of ideas. Rate each idea
based upon the criteria displayed. This criteria is defined by the
user.
Voting
- Paired Ranking
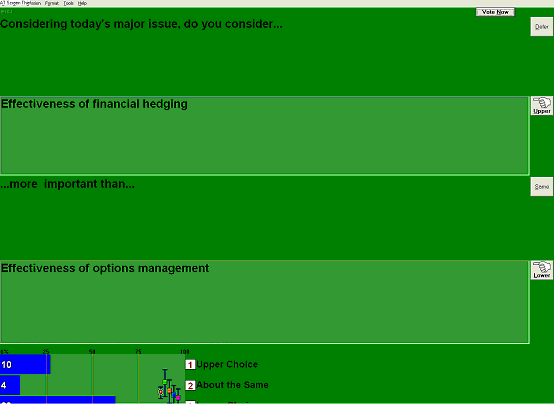
Voting for a
criterion which defines a ranking of ideas. Each idea is ranked
against each other idea based upon the context and comparison statements
displayed (which you defined). The Resolver* Ballot employs a powerful
technique which reduces up to 70% of the questions that could be
asked to complete ranking the ideas.
Charting
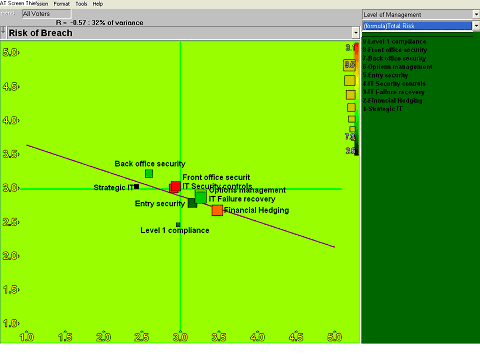
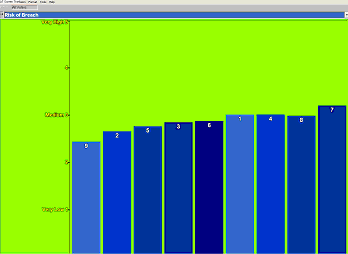
The charting
is done using a scatter chart plotting each idea on an XY Scale
of your criteria. Many presentation features have been incorporated
providing graphical analysis suited to an interactive exchange.
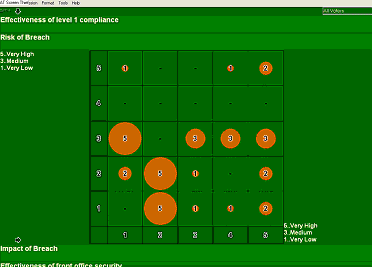
The multivariate analysis module provides a circle graph of the
voter responses showing the correlation by criteria.
Reporting
Print what you
see. Generate a report from any View in an Idea screen Table. Format
the report using the report format options and print or save to
HTML. Print or save a picture of voting results and charts as you
view each display.
|
